Graphic Appraisal Tool for Epidemiological Studies
Introduction
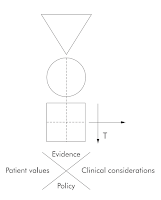
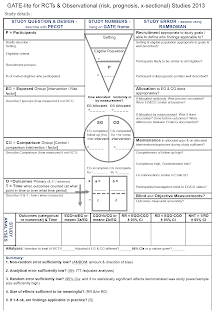
The Graphic Appraisal Tool for Epidemiological studies (GATE) is a simple, easily remembered toolkit to help you critically appraise epidemiological studies that include
- 1 picture
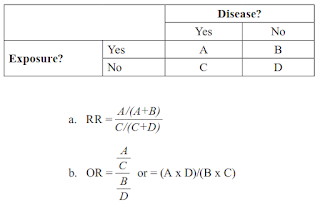
- 2 equations
- Occurrence = number of outcomes ÷ number in study group
- Random error = 95% CI
- 3 acronyms
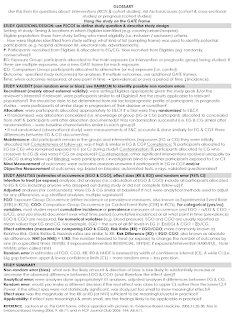
- PECOT - Participants, Exposure, Comparison, Outcome, Time
- RAMBOMAN - Recruitment, Allocation, Maintenance, Blind, Objective Measurement, Analysis
- FAITH (for systematic review)- Find, Appraise, Include, Total up, Heterogeneous
Incidence and Prevalence
Incidence = Measure of the probability of developing a disease
- Incidence rate: Number of new cases of disease per population in a specified time.
- Calculated by dividing the number of individuals who develop a disease during a given period by the number of individuals who were at risk of developing a disease during the same period.
Prevalence = Measure of the number of individuals who have a condition/disease at any given time.
- Point prevalence: Prevalence on a given date
- Period prevalence: Prevalence in a period (e.g. year, month)
Risk Ratio and Odds Ratio
Risk means the likelihood of an event.
Risk ratio (also known as the "relative risk" or "rate ratio") is calculated as:
(Proportion with the event in the intervention or exposed group) ÷ (Proportion with the event in the control or unexposed group).
Odds = (Proportion with the event) ÷ (Proportion without the event)
Odds ratio = (Odds for the intervention or exposed group) ÷ (Odds for the control or unexposed group)
NOTES:
- The RR cannot be directly calculated for most case-controlled studies; instead, the OR is usually an estimation of the RR. The RR can, however, be calculated for prospective studies.
- In general, we do not prove or show causality with observational studies, but it is important to recognize that, in many situations, the conduct of studies to establish causality is not possible, practical, or ethical.
Absolute Risk Difference (ARD)
This is simply (Proportion with the event in the intervention or exposed group) - (Proportion with the event in the control or unexposed group).
= [A/(A+B)] - [C/(C+D)]
Number Needed to Treat (NNT)
NNT is the number of patients we would need to switch from one set of circumstances to another in order to achieve one favourable outcome event.
- It is calculated as: 1 ÷ ARD.
Any fractional value is always rounded upwards to a whole number.
- A NNT of 50 means that 50 patients need to be treated to prevent one additional bad outcome, such as death, stroke or heart attack.


Comments
Post a Comment